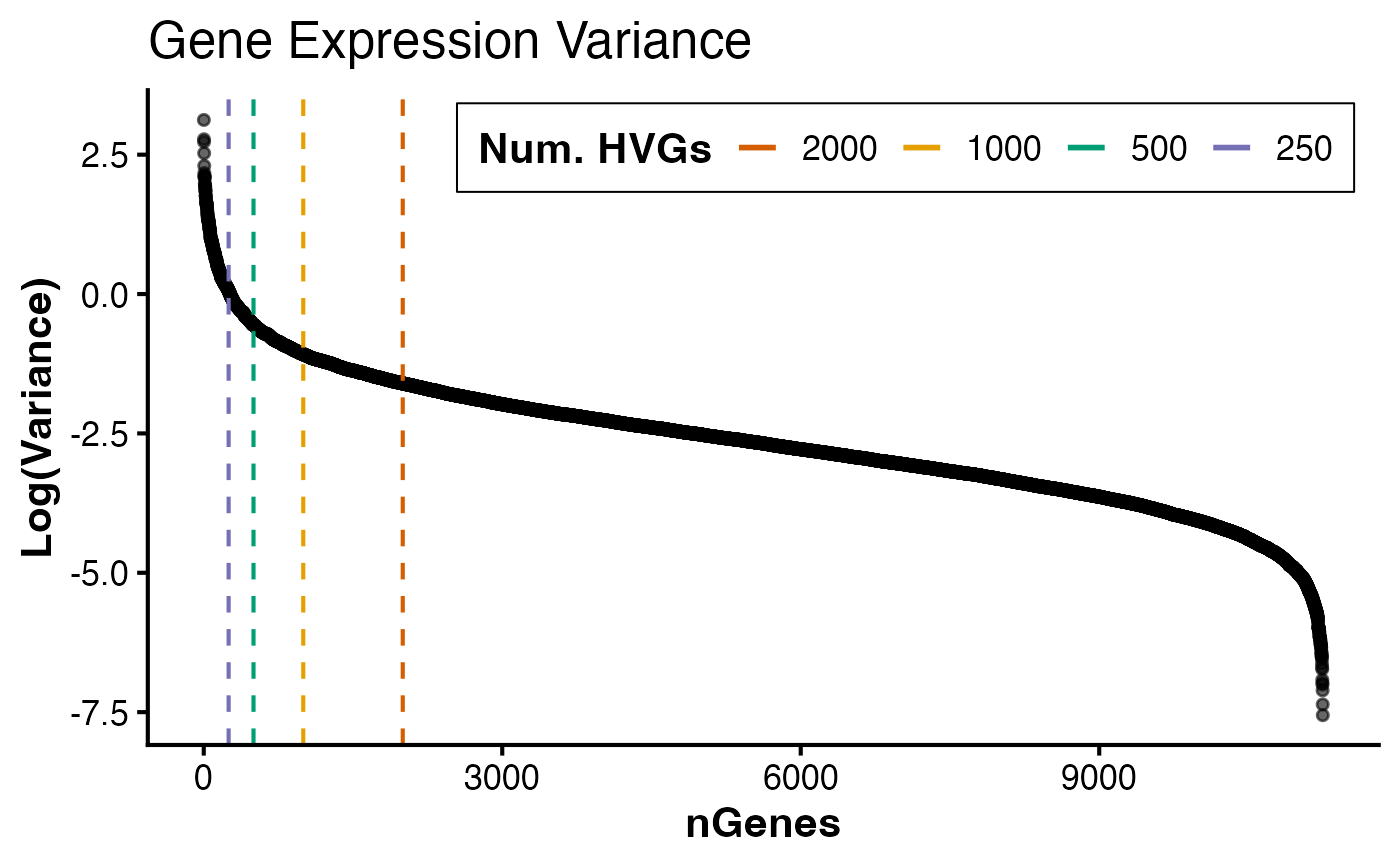
Plot variance for all genes (features) on a geneda object
using ggplot2.
Arguments
- object
A
genedaobject created byGenEDA().- transform
One of c("log") to log-transform variance, or NULL for none. Default = NULL
- dropTopN
Number of top-most variable genes to drop prior to plotting. Default = 0
Examples
data(Snail1KO)
counts <- as.matrix(Snail1KO$rawCounts)
counts <- counts[rowSums(counts >= 10) >= 3, ]
meta <- Snail1KO$metadata
rownames(meta) <- meta$Sample
norm <- log2(t(t(counts) / colSums(counts)) * 1e6 + 1)
obj <- GenEDA(normalized = norm, metadata = meta, counts = counts)
PlotHVGVariance(obj, transform = "log")