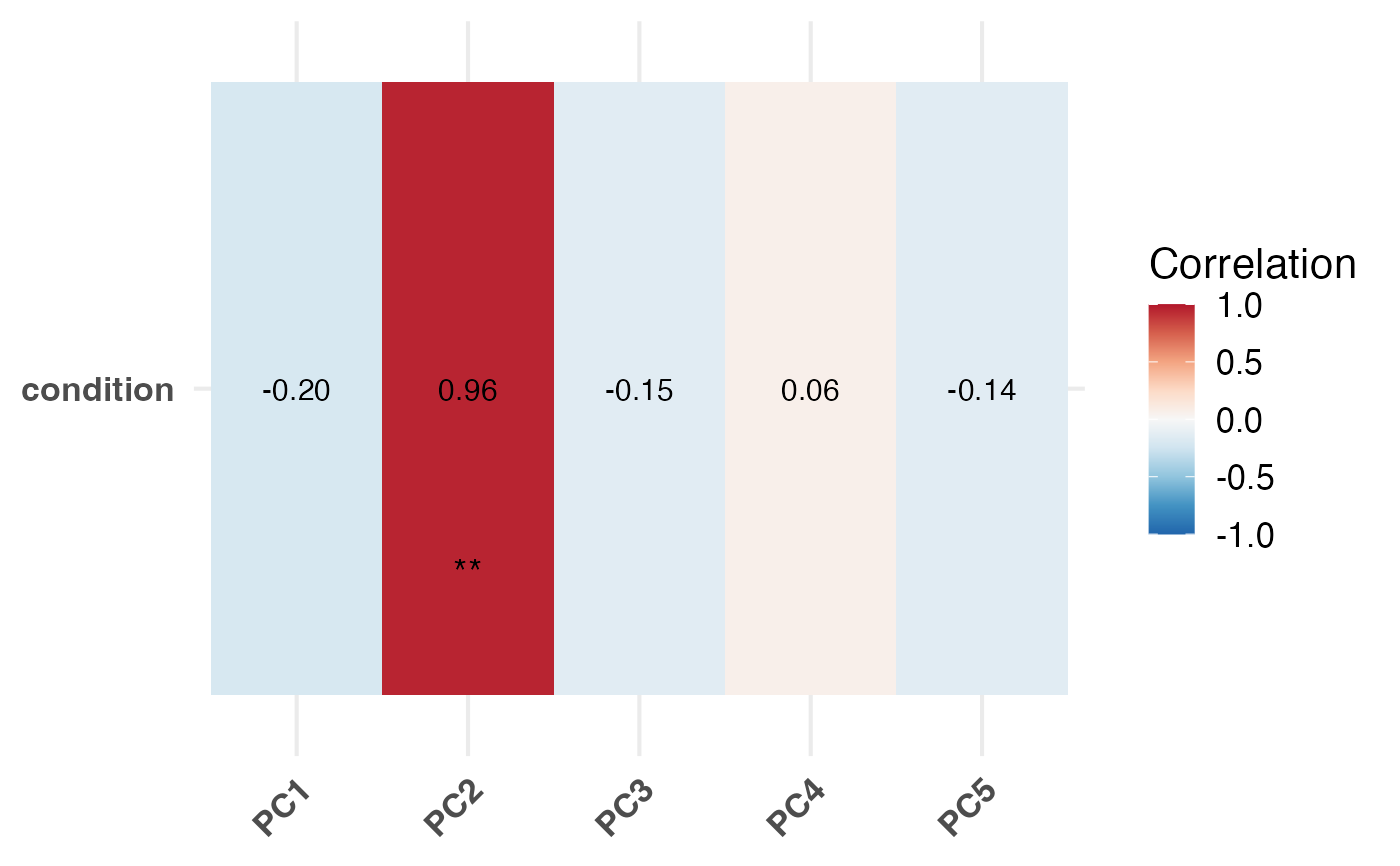
Plot Eigen-Correlation With Metadata Heatmap
PlotEigenCorr.RdCalculate Eigen-correlations from a geneda object and plot a
publication-quality heatmap using ggplot2 with numeric labels and
significance stars. For continuous variables, Pearson correlation is used.
P values follow this convention: p < 0.001, p < 0.01, p < 0.05 = three, two,
one stars, respectively.
Requires PCA loadings in DimReduction(object); does not recompute PCA.
PlotEigenCorr(object, num_pcs = 10, meta_cols = NULL)Arguments
Value
A list with elements: cor_matrix, pval_matrix, stars, plot (ggplot)
Examples
# \donttest{
mock_norm <- matrix(rnorm(5000 * 6, mean = 0, sd = 2), nrow = 5000, ncol = 6)
colnames(mock_norm) <- paste0("Sample", 1:6)
rownames(mock_norm) <- paste0("Gene", 1:5000)

# Sample metadata
mock_meta <- data.frame(condition = c("A","B","A","B","A","B"),
row.names = colnames(mock_norm))

# Construct GenEDA object
obj <- GenEDA(normalized = mock_norm, metadata = mock_meta)

# Run PCA
obj <- RunPCA(obj)
#> HVG slot is empty. Running FindVariableFeatures with top 2000 genes
#> Calculating principal components from top 2000 HVGs
#> Percent variations:
#>       PC1       PC2       PC3       PC4       PC5       PC6
#> "21.16 %" "20.71 %"  "19.9 %"  "19.4 %" "18.82 %"     "0 %"

# Compute eigencorrelation plot using first 5 PCs
ec <- PlotEigenCorr(obj, num_pcs = 5)
ec$plot

# }
# }