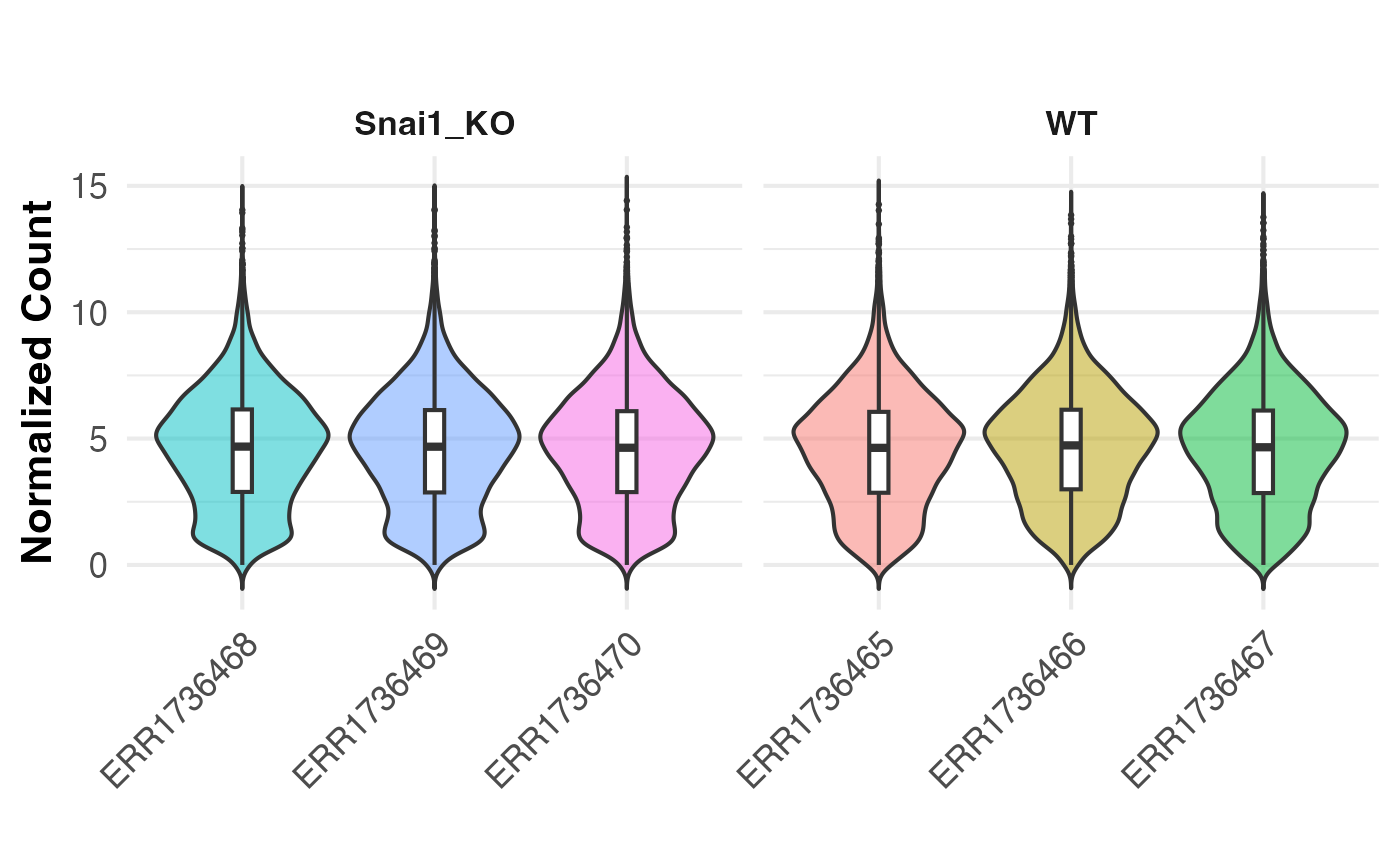
Generates violin plots with embedded boxplots showing the distribution
of normalized or VST-transformed RNA-Seq counts for each sample in a
geneda object. Optionally, plots can be faceted by a metadata variable.
Examples
data(Snail1KO)
counts <- as.matrix(Snail1KO$rawCounts)
counts <- counts[rowSums(counts >= 10) >= 3, ]
meta <- Snail1KO$metadata
rownames(meta) <- meta$Sample
norm <- log2(t(t(counts) / colSums(counts)) * 1e6 + 1)
obj <- GenEDA(normalized = norm, metadata = meta, counts = counts)
PlotCountDist(obj)
 PlotCountDist(obj, split_by = "Genotype")